- Merito
- Posts
- Fix Your AOP Before FY27 Starts
Fix Your AOP Before FY27 Starts
Done. Send to finance.
D2C x Annual Operating Plan
Hey readers,
Welcome to the eighteenth edition of D2C Cents!
TLDR - We are your scroll-friendly, no-fluff download of what's shaping India's D2C brands.

This edition? It’s about your Annual Operating Plan (AOP).
Your AOP is either:
Done and sitting in a folder (probably wrong)
Half-finished and stressing you out (definitely wrong)
Not started yet (full panic mode)
Most founders treat AOP like filling out a form.
Revenue target? ₹15 crore.
Marketing budget? ₹3 crore.
Done. Send to finance.
If we spend X on ads, what revenue can we realistically expect? That's the core question. Syncing ad spend with revenue expectations so you're not blindly pouring money into Meta and Google, hoping something sticks.
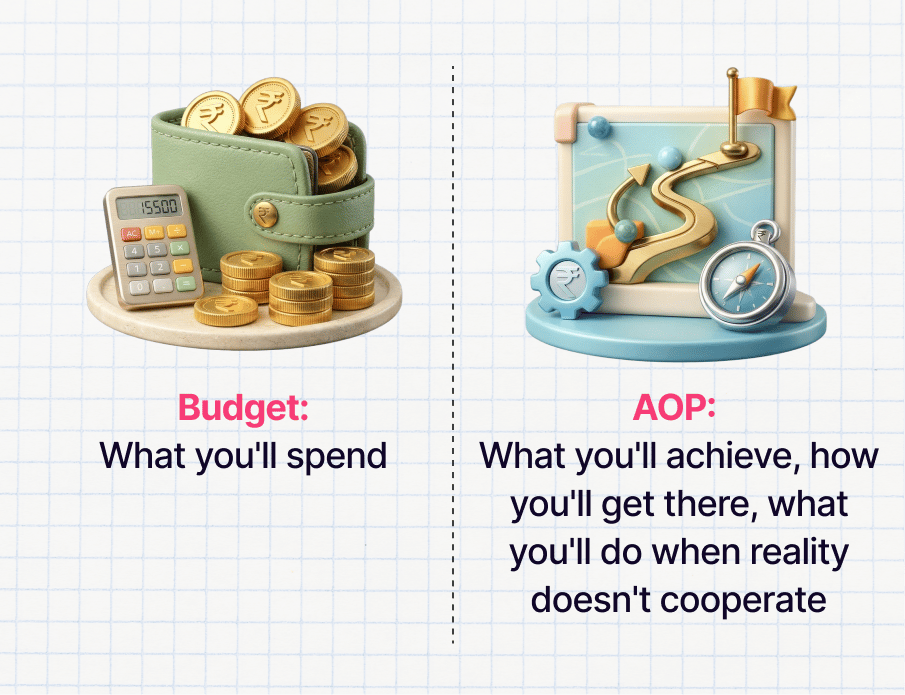
Your AOP will be wrong. Q2 won't play out the way you think. CAC will spike. That new product launch will get delayed. CM2 will tank because 3PL rates went up. These failures are just a part of business.
The AOP's job is to give you a decision framework when things go sideways.


Mistake #1: Confusing Budget with Strategy
You set ₹15 crore revenue, reverse engineer Meta ad spend, call it a day. That's an Excel sheet without any depth.
Mistake #2: Top-Down Without Bottom-Up Validation
Leadership declares, "We need ₹15 crore and 30% CM2." Sounds great. Then your teams do the math, and there’s a gap:
Bottom-up total: ₹11 crore
Top-down target: ₹15 crore
Gap: ₹4 crore
Closing out that gap is the actual AOP work. Most people skip this part.
Mistake #3: No Recalibration Until December
"We'll review in December" means you've already lost.
If you miss Q1 by 20%, don't pretend Q2 will magically fix it. Good AOPs have quarterly decision gates.

Revenue growth looks great on slides, but revenue with tanking CM2 is a death spiral. Your AOP needs four layers, one key output metric per layer, with a few input metrics driving it.
Layer 1: Revenue (But Granular)
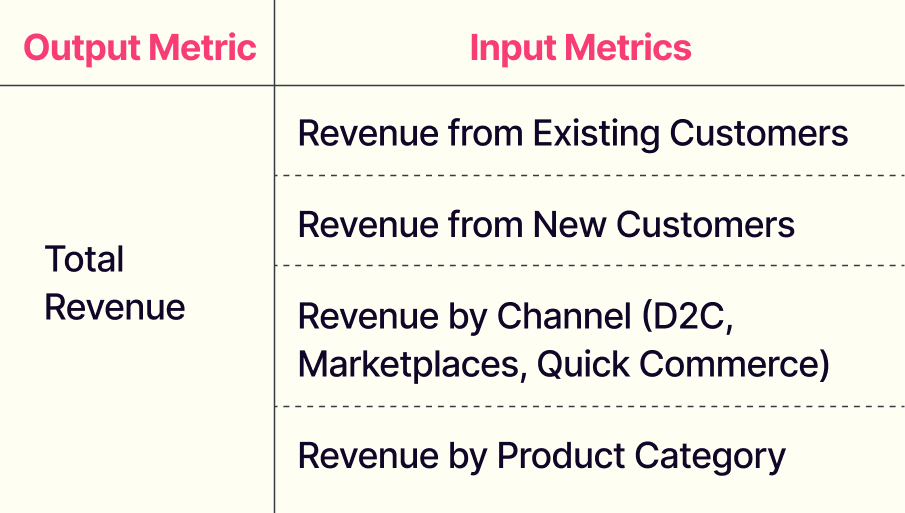
Don't write "₹15 crore" and call it a day.
Break it: ₹9 crore from repeat customers, ₹6 crore from new acquisitions. Then go deeper, D2C site contributes ₹8 crore, marketplaces add ₹5 crore, quick commerce brings ₹2 crore.
And don't divide ₹15 crore by 12 for monthly targets. Diwali isn't in February. Your revenue curve shouldn't be a straight line.
Layer 2: Contribution Margin (Your Real Health Check)
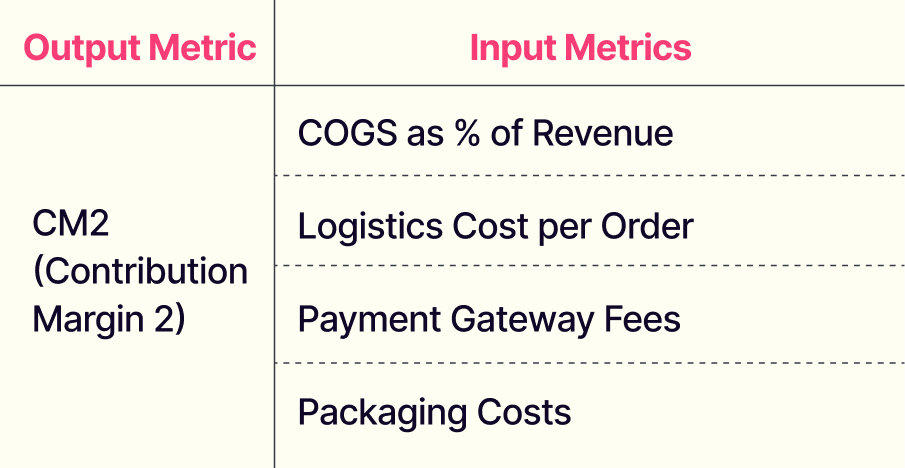
The math:
CM1 = Revenue - COGS
CM2 = CM1 - (Logistics + Payment + Packaging)
CM3 = CM2 - Marketing
If CM2 is under 25%, you're bleeding. Target 30-35%.
Plan how to get there quarter by quarter, not with "we'll improve margins somehow as the year goes on."
Layer 3: Customer Economics
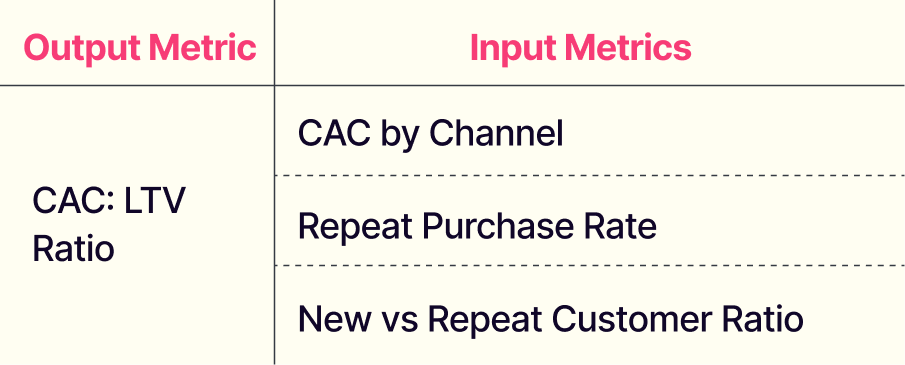
If you're spending ₹1,200 to acquire a customer who buys once for ₹800 and never returns, your unit economics are broken. No amount of scale fixes that.
Layer 4: Operational Efficiency
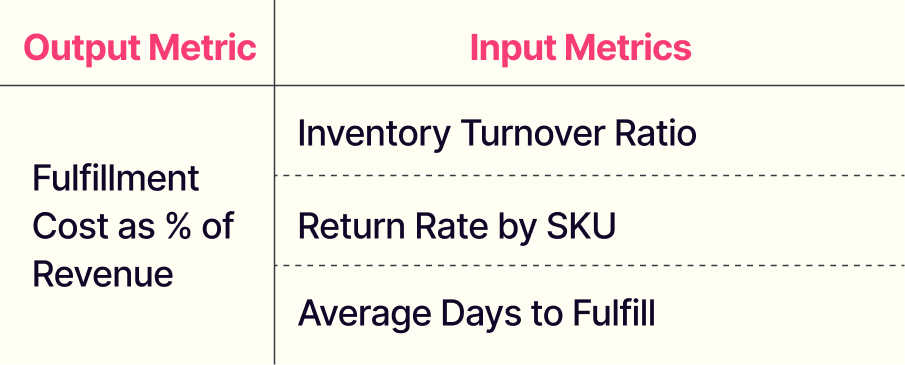
This silently kills CM2 when you're not watching. Returns eat margins. Slow inventory ties up cash. Track monthly.

Top-down sets the company goal. Bottom-up answers how you'll actually achieve it.
And this is critical because when you know you need to hit revenue targets while maintaining CM2, you then intentionally take steps to drive your product mix towards higher-margin SKUs.
Top-Down (Leadership Sets Direction):
"We need ₹15 crore revenue, 30% CM2, and break-even by Q4."
Bottom-Up (Teams Validate Feasibility, 4 cr shortfall):
Performance marketing runs the numbers: "At current CAC of ₹1,200, we can acquire 35,000 customers spending ₹80 lakhs total. That delivers ₹4.2 crore revenue."
Organic and content team counters: "SEO plus email can drive ₹1.8 crore with a 15% repeat rate built in."
Marketplaces manager adds: "Amazon and Flipkart can deliver ₹3.5 crore, but CM2 will be 18%, not 30%."
Quick commerce lead warns: "Blinkit and Zepto can add ₹1.5 crore but require upfront inventory investment that hits cash flow."
This is why AOPs matter.
Your Revenue Isn't Linear (Stop Planning Like It Is)
D2C revenue doesn't climb in a straight line. January does not equal October, and your AOP better reflect that reality.
Use last year's trends as your starting point, then adjust for what you know is coming.
January and February are post-holiday slumps when consumers are tapped out.
March and April see the wedding season lift apparel and gifting categories.
May through August are slower months where you focus on retention and repeat purchases rather than aggressive acquisition.
September through November is the festive season prep and execution; this period delivers 30-40% of annual revenue for most D2C brands.
Your monthly targets need to reflect this, not ₹15 crore divided by twelve.

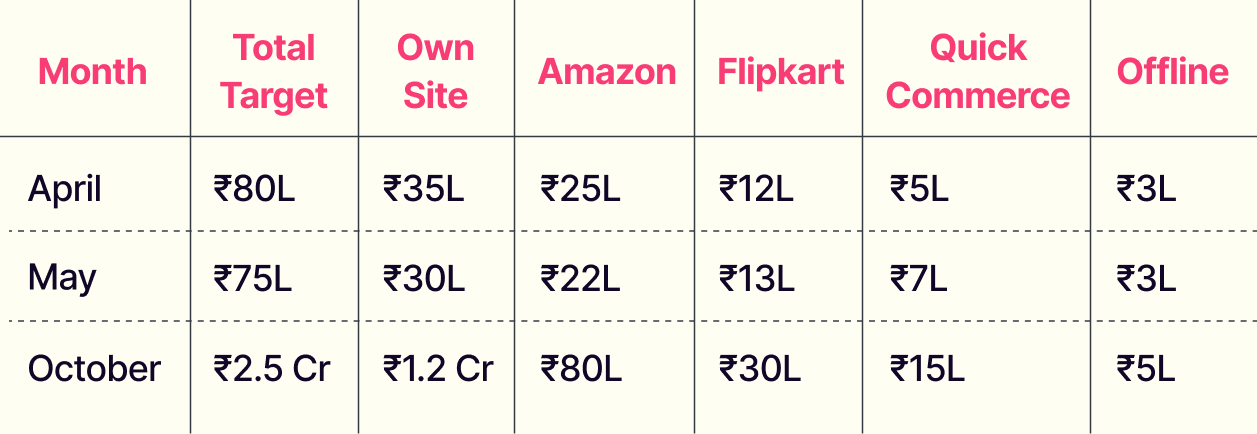
Breaking that notional ₹15 crore number into monthly channel targets is table stakes. What matters is ownership and weekly tracking.
Sample Monthly Breakdown:
Assign Clear Ownership:
Own website: Performance marketing lead
Marketplaces: Marketplace manager
Quick commerce: Operations + sales lead
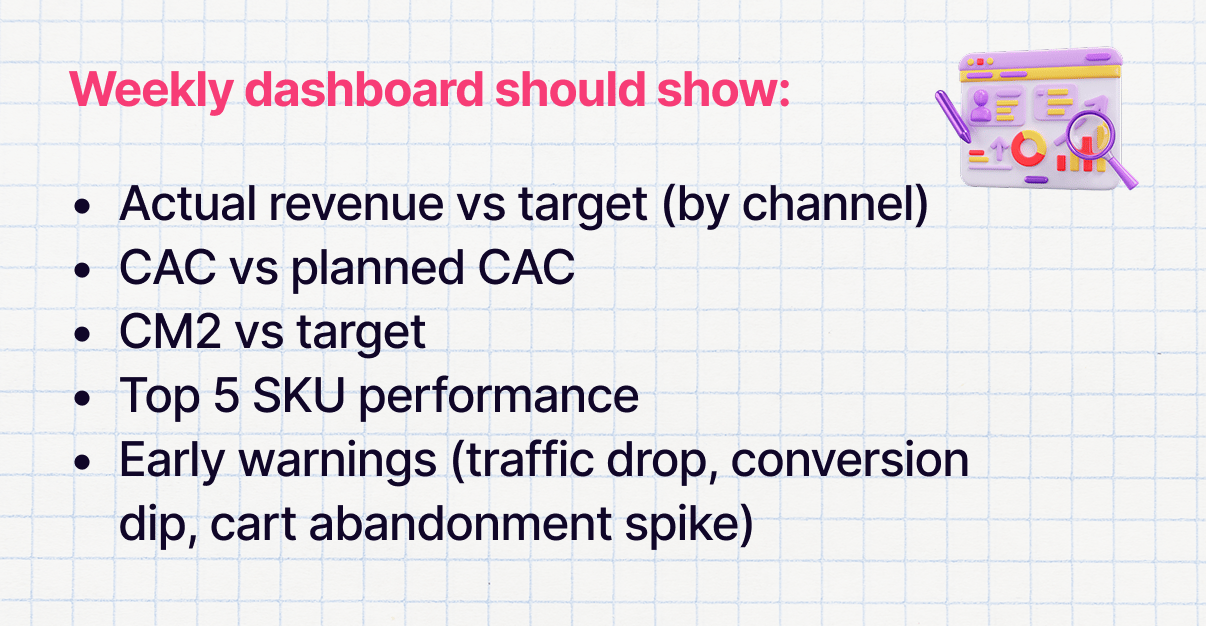
Track Weekly (Not Monthly)
By week 4, the month is done. You can't course-correct.
Monthly Review Triggers:
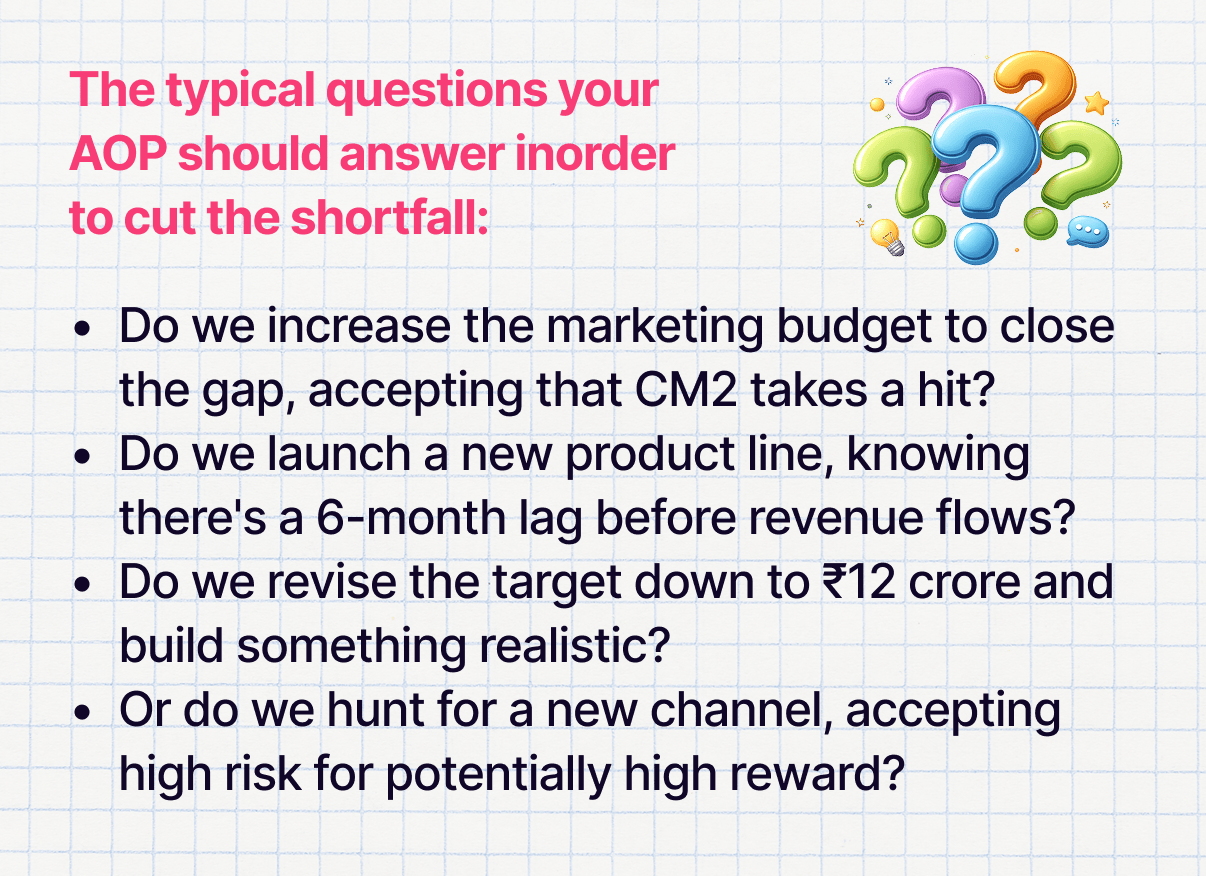
Miss by <10%: Minor tweaks, reallocate budget
Miss by 10-20%: Major channel strategy review
Miss by >20%: Revise Q2-Q4, don't pretend it'll bounce back

An AOP should give every team clear action items. Here's what that looks like in practice:
Marketing Team:
Improve retention to reduce expensive acquisition costs. Launch email nurture series for first-time buyers within 48 hours, build WhatsApp broadcast lists segmented by purchase history, and test SMS reactivation for 60-plus day inactive customers.
Target: move repeat purchase rate from 18% to 25% by Q4.
Finance Team:
Improve CM2 by four percentage points. Renegotiate 3PL rates in Q1 by consolidating volume, switch to lighter packaging in Q2 to reduce shipping costs, and consolidate payment gateways in Q3 for better fees.
Track CM2 improvement quarter over quarter.
Category Team:
Shift product mix towards high-CM2 SKUs. Discontinue bottom 10% SKUs by CM2, bundle slow-movers with bestsellers, and launch 2-3 premium SKUs with 50%+ margins targeting high-LTV customers.
Track the weighted average CM2 across the catalog.
Operations Team:
Reduce return rate from 12% to 8%. Add detailed size guides and product videos, implement stricter quality checks pre-dispatch, and analyze return reasons monthly to fix the top three issues.
Track return rate by product category.
We Built You a Template
AOP helps answer a key business question -
If we spend Rs. 'X' on marketing, how much revenue can we expect?
This template helps track and plan your website’s marketing performance in one place.
It uses past performance data like clicks, customers, orders, and AOV to build projections.
Based on planned budgets and growth assumptions, it forecasts clicks, orders, and revenue.
This helps plan marketing spend and set realistic sales and ROAS targets.

See you next edition - same time, deeper insights.
Until then, keep building strategically.
Abhishek